Debugging Notification Failures with Sent Log Details

Debugging Notification Hops with Log Trace

Log Details” is the pop-up that appears when you click on a notification log on the “Sent Logs” page, showing you all the details of the log.

To understand this better, let’s have a look at the “Log Details” with an example.

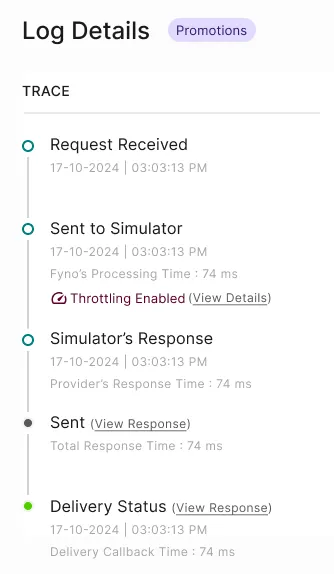
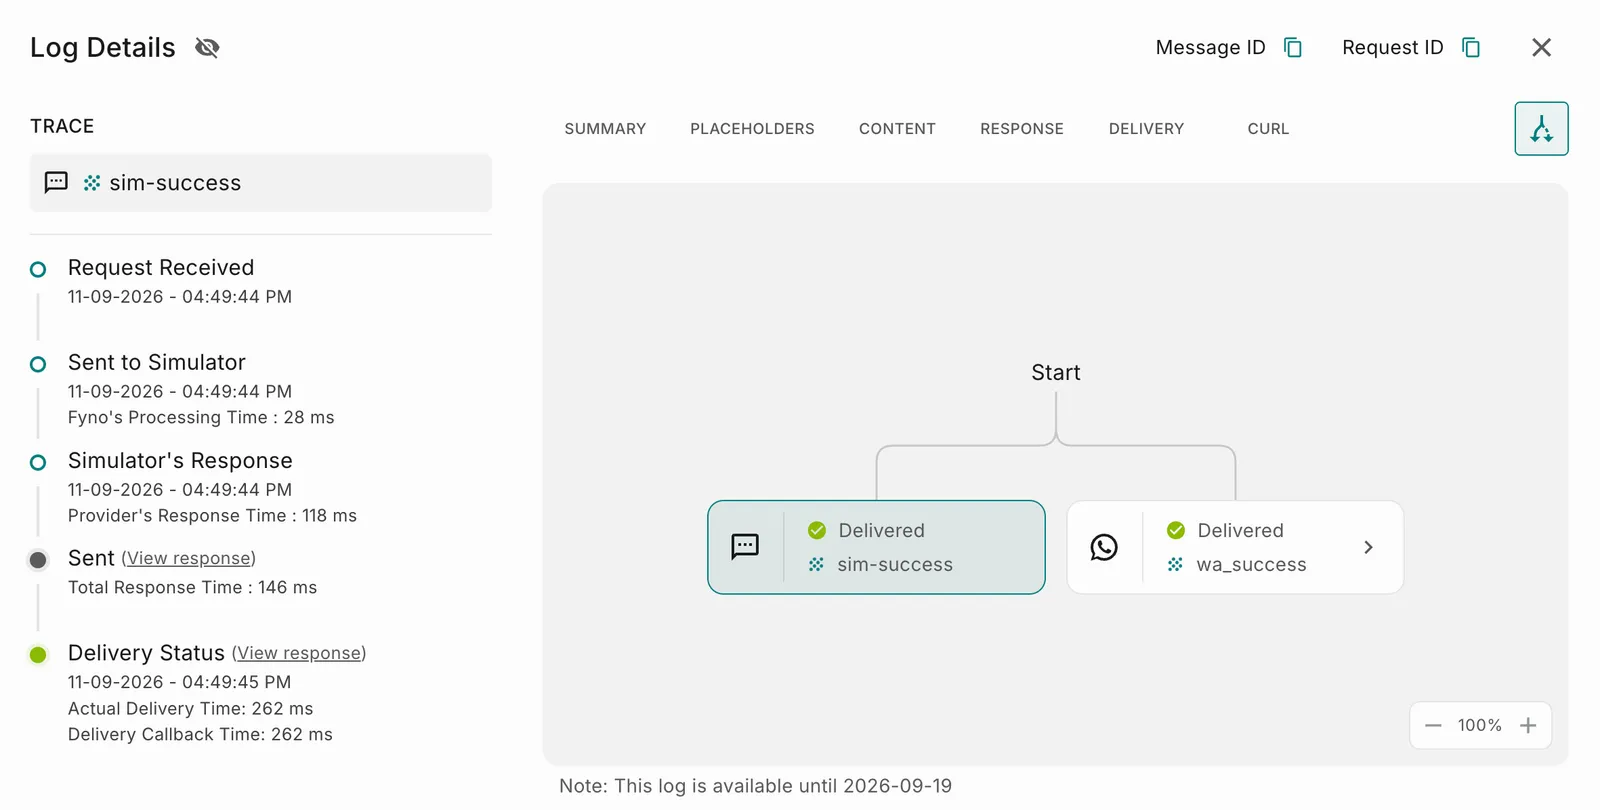
On the left side of the pop-up that appears, there is a “Trace

Trace” gives you a summary of each hop or path that the notification has taken along with the time that each hop has taken, including the total as well as the final status of the notification.

Request Received

The time the API was triggered and Fyno has received the request successfully to be executed further.

Sent To xxxxxxxx

In the example shown above, “Sent To Kaleyra.io” is seen because, according to the routing and event created and triggered, the provider details show up accordingly in this step.

The details shown in this field are the date and time this was sent to Kaleyra.io and the time it has taken for Fyno to process the request towards the provider. In this case, it’s 121ms.

xxxxxxx’s Response

In the example shown above, “Kaleyra.io’s Response” talks of the same details for the date and time the response was received from Kaleyra.io for the request that was made to their platform.

It also shows how much time it has taken to receive the response from Kaleyra.io in milliseconds. In this case, it has taken 147ms

Final Status

The last hop shows the final status of the notification at a glance. In this case, the notification was delivered successfully, so the hop shows as “Success”.

From this hop, you can also navigate to the a detailed view of the response by clicking on “View Response”. This will take you to the tab with the details of the final response.

You will also be able to see what the total time taken for the entire lifecycle of the notification was. In this case, we can see that it has taken 268ms total for the entire notification to be triggered and for a final status to be updated.

Delivery Status

This hop only shows up on the trace if and when we have a delivery response from the Provider

In case the Delivery Status is visible, then you will also be able to see the timestamp for when the delivery status was shared.

Reviewing Notification Trace and Summary Logs

When you open the log details of a notification, the first thing you will see is the Trace and summary details on the “Summary” tab.

To understand and read this summary better, let’s have a look at some of the key details within the “Summary” Tab

Message ID

Message ID is the unique identifier for the message that has been sent.

This is highly unique, in a way that this is very specific to the transaction that has happened only with that provider. So, in case you have 2 operators configured, one as primary and the second one as failover, in this case, if the message fails with the primary operator, and is triggered via the failover provider, each interaction with every provider will have a log and a unique “Message-ID”

Request ID and Message ID are linked!
The first half of the Message ID is made up of the “Request ID” and the unique part is the last 4 characters of the “Message-ID” will be unique to each provider

Request ID

A “Request ID” is a unique ID that is assigned to a request that is being triggered through Fyno’s Application.

A request which has a notification event that triggers a notification to flow through multiple providers will still have the same “Request ID” since that action was triggered by one request.

So, in case you want to find out what has, for example, happened for one request that has multiple providers configured in the routing or the notification event, you can search by the “Request ID” in the “Filters” and you will get the details for all of the logs for that particular “Request ID”

Channel

“Channel” shows you the channel that was used for the notification that was triggered.

“Channel” can be Messaging (SMS), WhatsApp, Email, Chat or Push

Provider Name

“Provider Name” displays the provider that was used to trigger the notification you are currently viewing. This may vary depending on your routing and notification event configurations

Destination

“Destination” displays the final recipient’s details. This may be a phone number, email ID or a Chat channel ID

Date

“Date” shows the date the notification was triggered by you, via the Fyno App

Time

“Time” shows you the time that the notification was triggered by you, via the Fyno App

Integration Custom

“Integration Custom” is the name that you have given to the integration when you are creating a “Provider” under a “Channel”

Routing

“Routing” refers to the routing that you have created under the “Integrations” section.

Template

“Template” shows you the name of the template being used in the notification that you have created under the “Templates” section.

Notification Event

“Notification Event” shows you the name of the notification event that was triggered, which was created in the “Notification Events” section, because of which a notification was triggered, creating this log.

Retry

“Retry” shows you the attempt number which this notification was under. This is nothing but the attempt count of a notification event.

So for example, if a notification event has 2 Providers configured, and the notification fails to deliver from the first provider and delivers from the second provider, then there would be 2 notifications logs and the first retry (which failed) will show “Retry” as “0” and the second notification log which did get delivered would show “Retry” as 1.

Debugging Template Placeholders in Logs

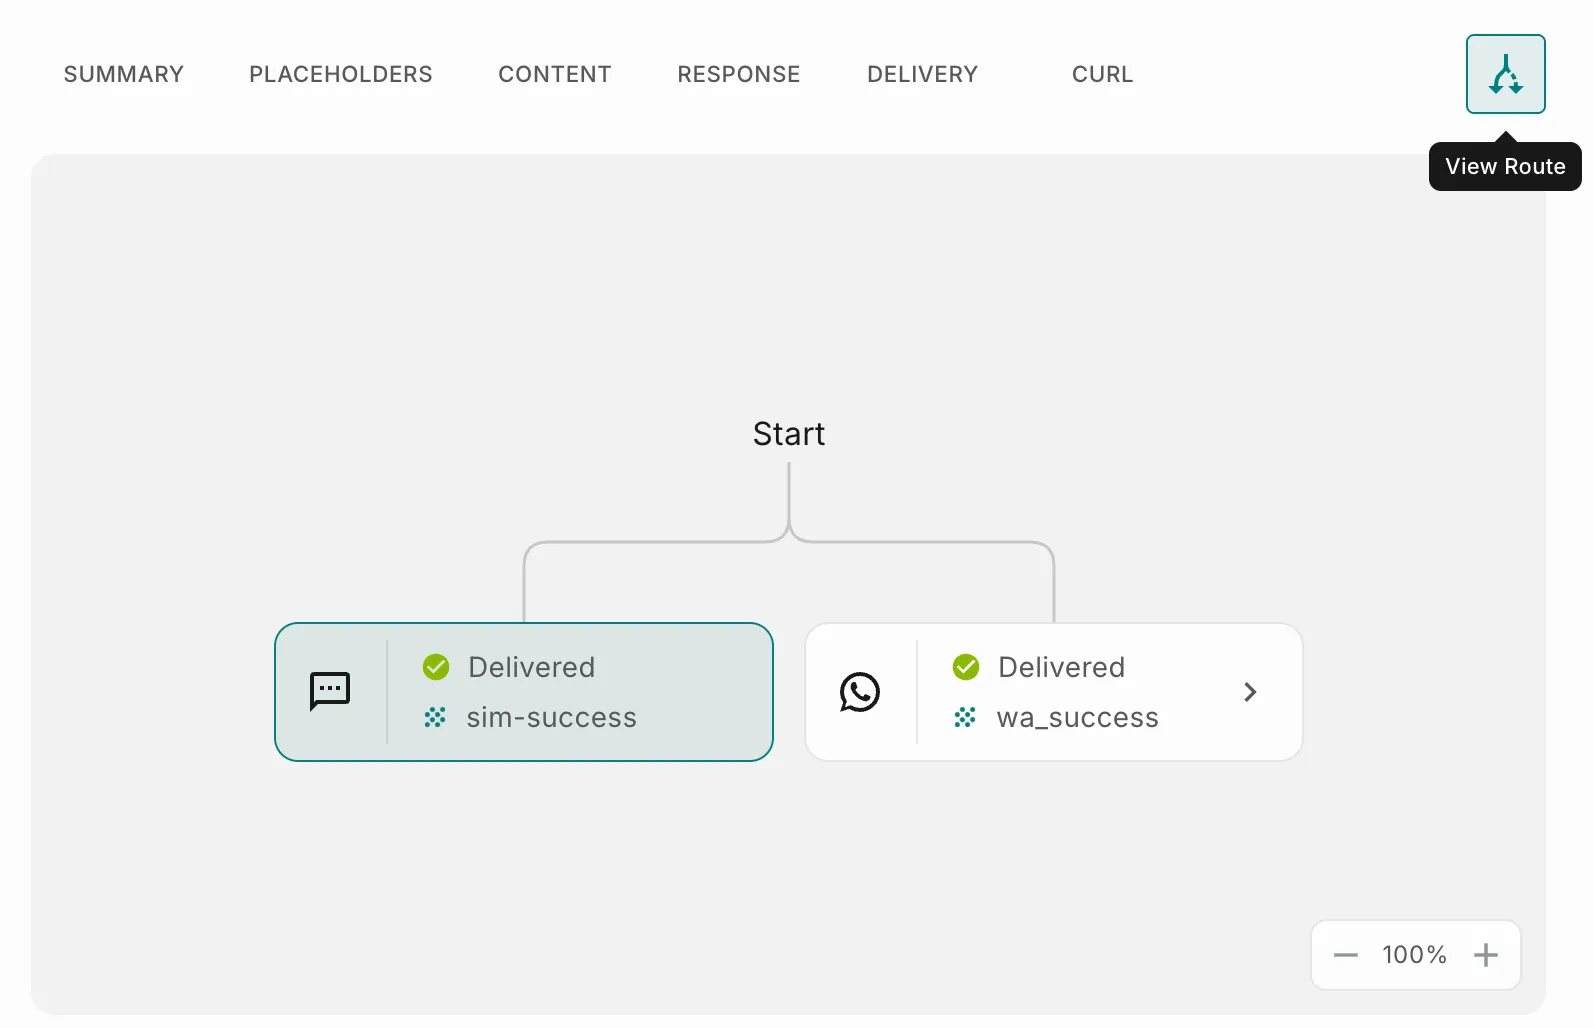
On the “Log Details” pop-up, the second tab on the ribbon menu you will see is “Placeholders”.

Placeholders shows you the details of all the placeholders or the replaceable parameters that were in the “Template” that was used to trigger the notification event.

No details in Placeholders?
If the “Placeholders” tab shows no details, this only means that the content that was triggered in the notification had no replaceable parameters to be displayed.
If any placeholders or base64 attachment size is greater than 1 MB, then you will see ‘content omitted due to size’ as we don’t store any content > 1 MB at our end.

Understanding Log Content Details

On the “Log Details” pop-up, the third tab on the ribbon menu you will see is “Content”.

The “Content” tab shows you all the details of the content that has been triggered in the notification.

Depending on the channel being used, it can show you a wide variety of details like:

  • Message content - The written or static and replaced parameters ( if any) part of the message
  • Type of Message - Anything from Unicode to plain text to media types, depending again on the content and the “Channel” that was used.
  • Template ID - In case the notification was an SMS and it has a Template ID, the same will be mentioned as well
  • Subject: In case the notification triggered was an email, this will show the subject line of the email sent
  • Body - In case the notification sent was an email, this will display the content that made up the body of the email
If any placeholders or base64 attachment size is greater than 1 MB, then you will see ‘content omitted due to size’ as we don’t store any content > 1 MB at our end.

Analyzing Provider API Responses in Logs

On the “Log Details” pop-up, the fourth tab on the ribbon menu you will see is “Response”.

In this tab, you will find everything to do with the response received for the notification that was triggered to the “Provider”.

Fyno will display the exact response that has been received from the “Provider”, including details like:

  • Error code, if any
  • Final status of the notification
  • Message “Content” as well as “Trace” details

Tracking Notification Delivery Status in Logs

On the “Log Details” pop-up, the fifth tab on the ribbon menu you will see is “Delivery”.

The delivery tab is dependent on the information relayed from the providers. You will see a delivery status tab only for providers who send the Delivery Status.

The Delivery tab will show you the details of the delivery response that Fyno has received from the “Provider” that was used to send the notification.

This tab may not be visible in cases where Fyno has not received any information from the “Provider” about Delivery Status

On that note, let’s have a quick look at the types of Providers based on the Delivery Status

  • Delivery status sent, with no extra configuration needed.
  • Delivery status can be sent, configuration required
  • Delivery status not sent, configuration not available

Delivery Status Sent, No Extra Configuration

There are providers within some services that readily share the delivery status of the notification without having to configure webhooks or callbacks at their end. They are:

Delivery Status can be Sent, Configuration Needed

Some other providers need to be configured to send the delivery status. For these Providers, once configured the delivery tab will show up in logs. These are:

However, there are a few providers that don’t provide the delivery status and we will be unable to fetch that data. We would request you to check with your provider for more details on the same.

Delivery Status Not Sent, Configuration not available

Some providers do not have the feasibility to share the delivery status, and thus this cannot be shared. For these providers, the Delivery tab will not be visible. They are: