

Alarms
Alarms give you a single place to see every issue Fyno detects while delivering notifications to your users, from provider errors and rate limits to template changes made by channels like Meta. Each alarm is tagged with a severity so you can decide what to fix first. Addressing alarms promptly keeps your deliverability healthy and makes sure your notifications consistently reach your users.
Alarms summary on the Dashboard
The Alarms card on your Dashboard shows how many alarms are currently unresolved, broken down by severity. Click View All to open the Alarms page.
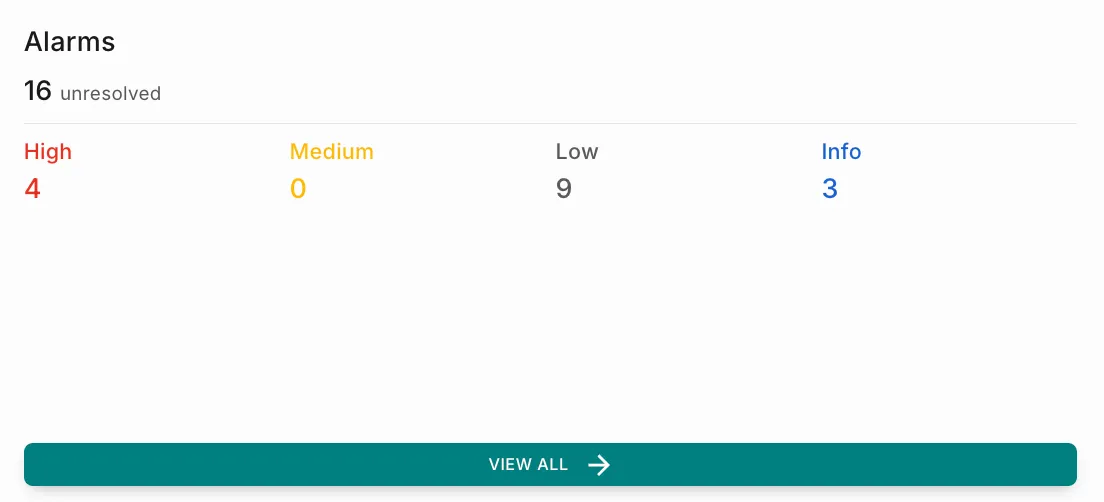
Severity levels
Alarms page
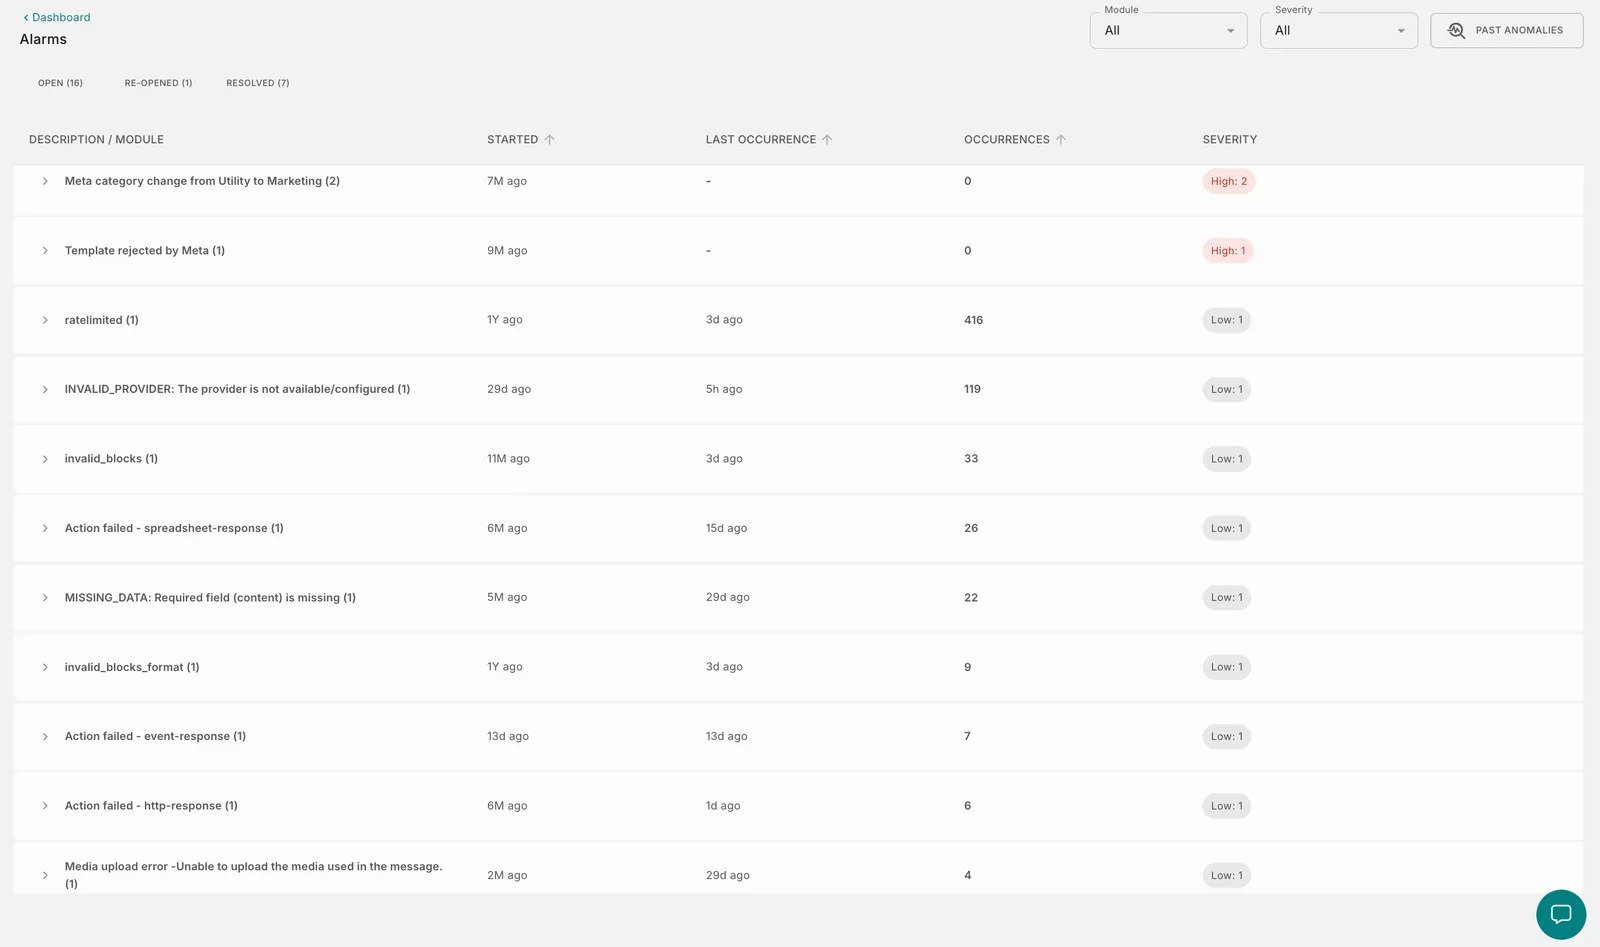
The Alarms page lists every alarm raised in your workspace.
Status tabs
Alarms are split into three tabs, each showing the number of alarms it contains.
Filters
Use the filters at the top right to narrow down the list.
- Module: shows only the alarms raised in a specific part of Fyno, such as a notification event, workflow, webhook, provider, integration, or WhatsApp template.
- Severity: shows only alarms of the selected severity.
How alarms are grouped
Alarms with the same description are grouped into a single row. The number in brackets next to the description is the number of alarms in that group. For example, Meta category change from Utility to Marketing (2) means two templates have raised this alarm. Click the arrow next to a row to expand the group and see each individual alarm.
Columns
You can sort by Started, Last Occurrence, and Occurrences by clicking the column header.
Some alarms are raised by a one-time change rather than by repeated delivery failures, for example when Meta rejects a template or changes its category. These alarms show 0 occurrences and - as the last occurrence, but they stay open until you resolve them.
Alarm details
Click any alarm to open its details.
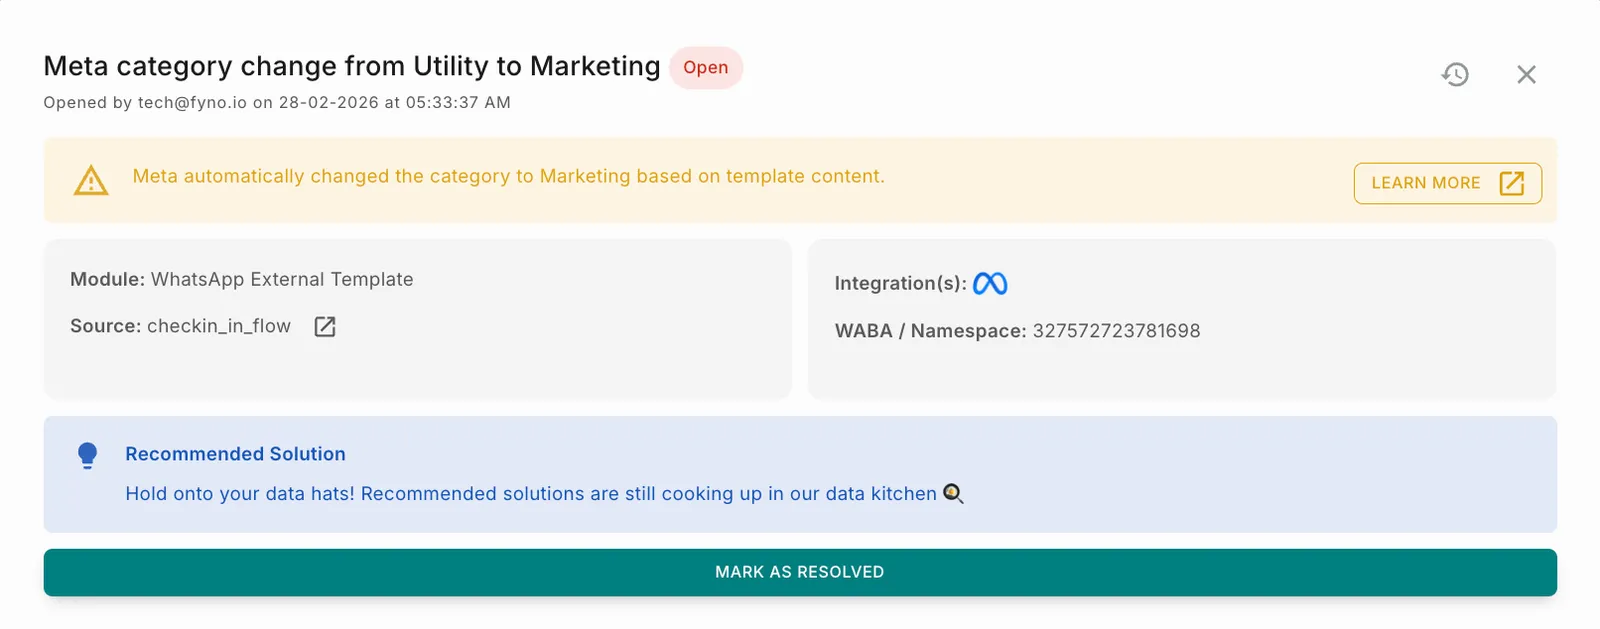
The details view contains:
- Title and status: the alarm description and its current status (Open, Re-opened, or Resolved), along with who opened it and when.
- Explanation: a short description of what happened. Click Learn More to read more about the issue.
- Module and Source: the module where the alarm was raised and the specific resource that caused it, such as the template name. Click the link icon next to the source to open it directly.
- Integration(s): the integration involved, along with its account identifier. For WhatsApp, this is the WABA / Namespace.
- Recommended Solution: suggested steps to fix the issue, where available.
Resolving an alarm
Once you’ve fixed the underlying issue, click Mark as Resolved. The alarm moves to the Resolved tab. If the same issue occurs again, the alarm moves to the Re-opened tab so you know the fix didn’t hold.
Viewing the change log
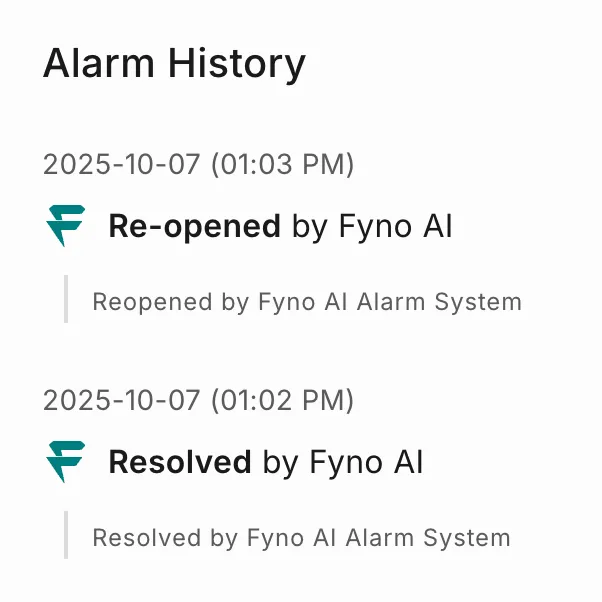
To see the history of an alarm, click the history icon at the top right of the alarm details. The Alarm History panel lists every status change with its date and time, who made it, and any note added. Alarms that re-open automatically are shown as re-opened by Fyno AI. This is useful when an alarm has been re-opened and you want to know who resolved it earlier.
Anomalies
Fyno also watches your delivery trends for unusual spikes or drops, called anomalies. Click Past Anomalies at the top right of the Alarms page to review anomalies detected in your workspace.
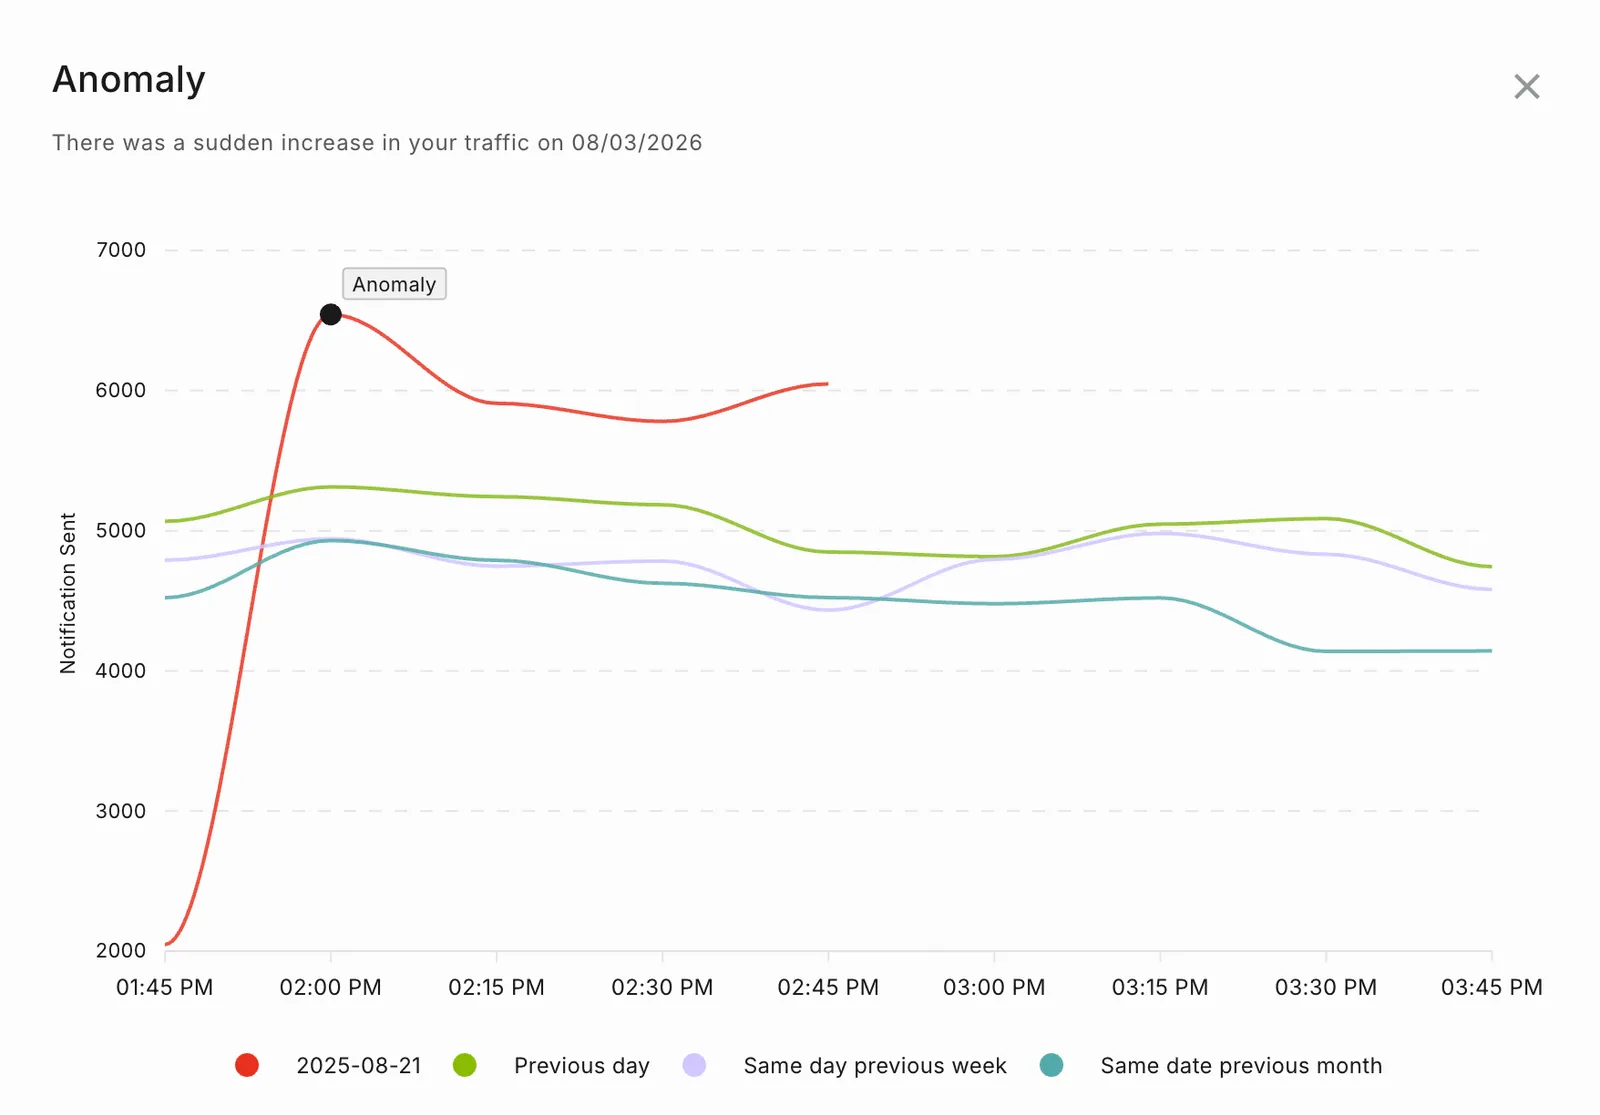
The anomaly chart plots delivery status over time so you can see exactly when and how the pattern changed:
- Channel: use the dropdown in the chart title to switch between channels, for example Email Delivery Status.
- Status lines: Requested, Delivered, Bounce, and Error are plotted separately. Click a status in the legend to show or hide it.
- Count or percentage: use the # and % toggle at the top right to switch between absolute numbers and percentages.
- Zoom: use the zoom controls at the bottom right to focus on a specific time range.